As Australia gets ready to dispense the vaccine on the masses, will our share market still lag behind the rest of the world? Should we allocate more or less to the Australian market?
Australia’s success in containing the Coronavirus, and the relative value of some Australian companies, has given rise to a 13% increase in the All Ordinaries Index over the last 6 months. Will this trend continue or are you better off taking some profits?
If we look at numbers, it is not all that rosy in Australia compared to the value you can get from overseas share markets.
We have rebalanced our model portfolios to give a greater weighting to Asian markets; in particular technology companies.
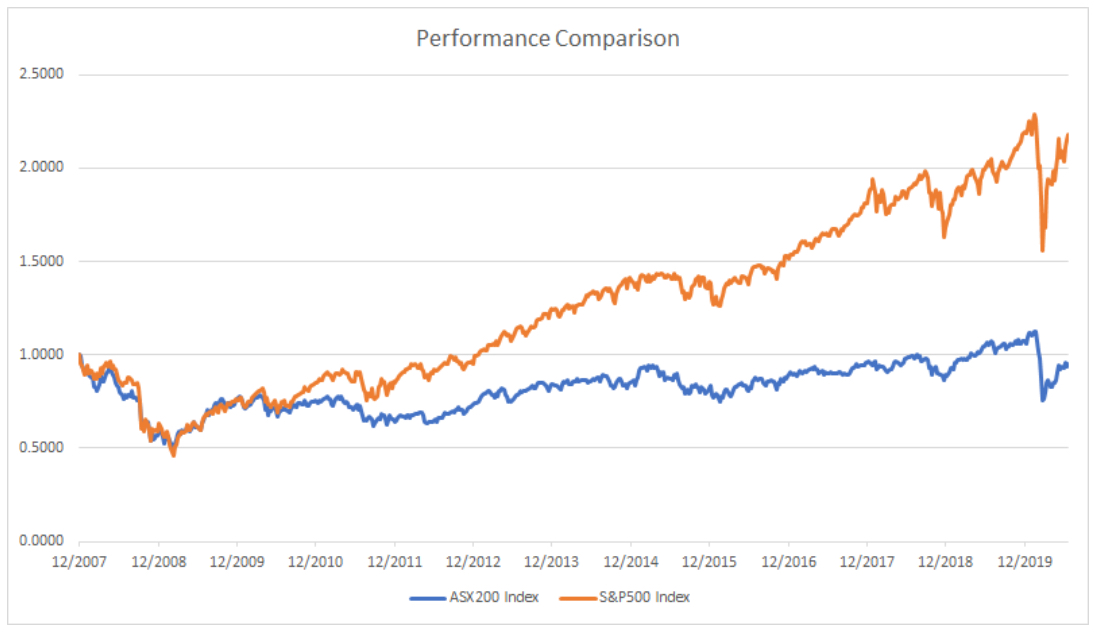
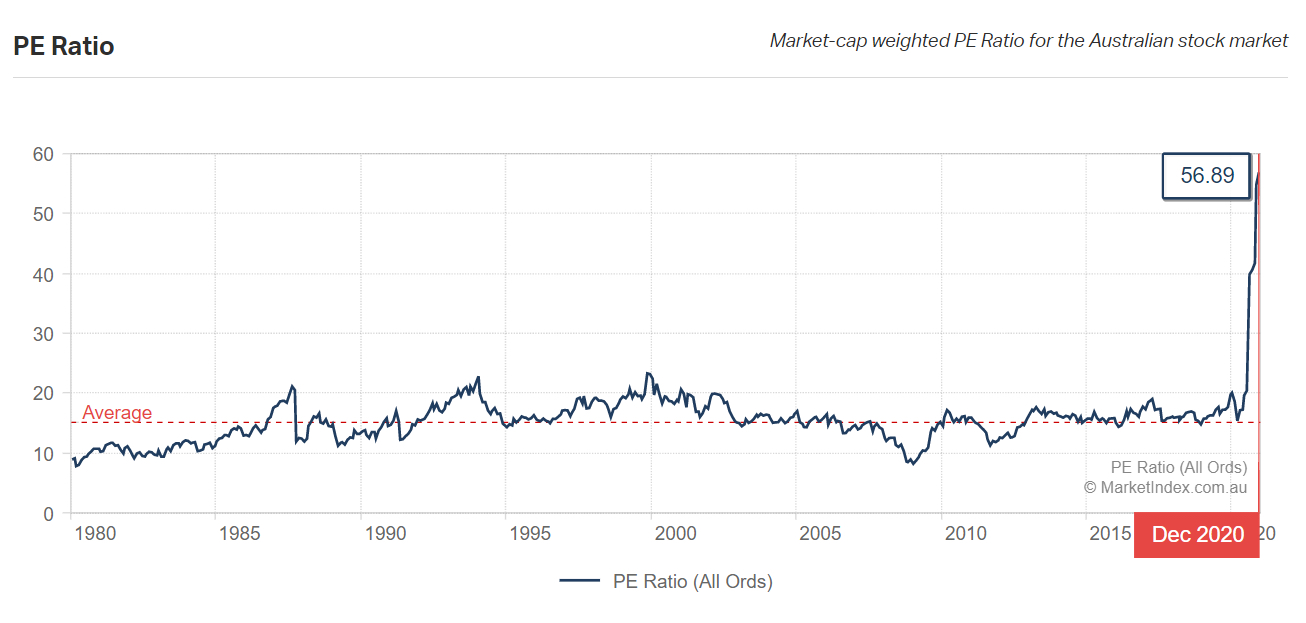
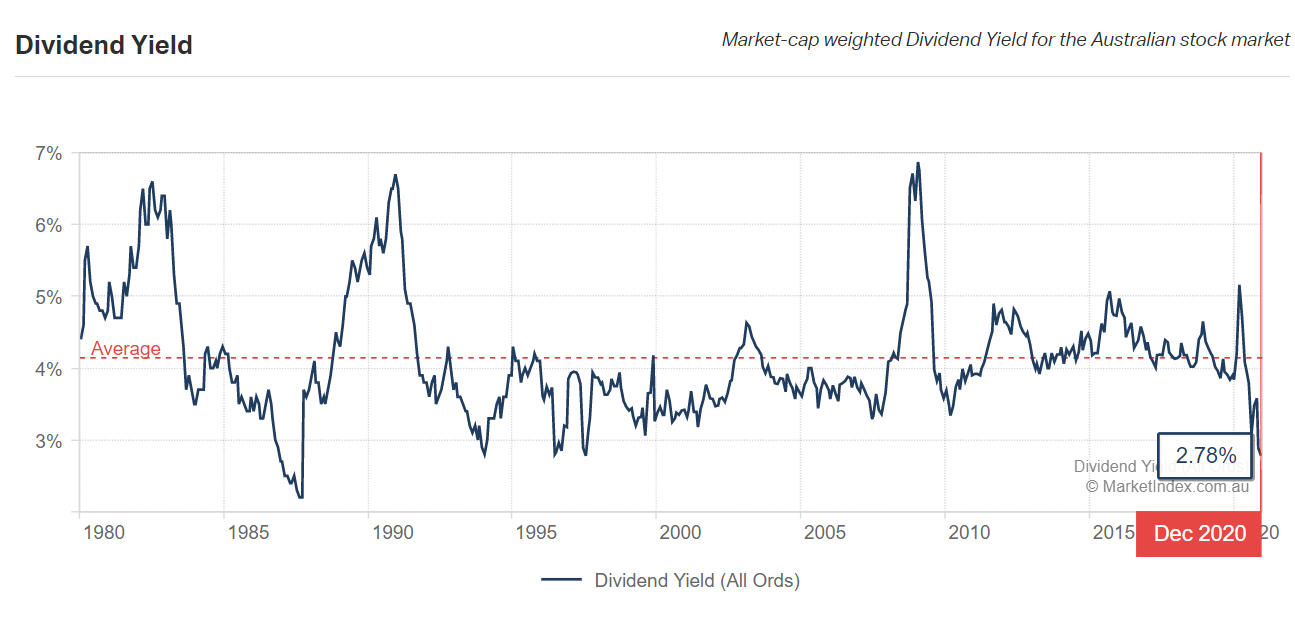
I have been saying since 2008 that Australia’s share market would underperform the U.S share market. Our share market is priced differently to the U.S. as the below charts show. We pay out more and retain less so for companies to grow, they have to borrow. Low interest rates are helping our companies get their balance sheets in some sort of order. Just like our domestic balance sheets, we have been saving money at a greater rate than any time in the last 30 years.
Comparison of the Australian All Ordinaries Index vs the U.S S&P 500 since the GFC

In order to compare like for like, both indices have been rebased to a starting value of 1. Source Rivkin data.
How do the two countries compare when it comes to growth?
Since 2008, the average annual GDP growth in Australia has been 2.52% while in the US, it was almost three quarters of a percent lower at 1.85%. Therefore, economic growth is not the indicator we should use when it comes to share market growth. The next possibility is that price/earnings (P/E) ratios give us a better guide to the relative value of share markets. Albeit a little simplistic, a high P/E ratio implies that the share price is high for a given level of earnings and therefore the company is ‘expensive’. The current P/E ratio for the Australian All Ordinaries Index is 56.89. This is way above the long-term trend of 20, which is still more expensive than the U.S.

Perhaps we need to keep digging to find differences in the ASX and U.S S&P. The dividend yield gives a measure of how much capital companies are paying out in dividends rather than retaining as earnings. For the ASX200, the dividend yield is around 3.11%, which compares to just 1.90% for the S&P500. Specifically, the dividend payout ratio specifies what percentage of a company’s earnings are paid out as dividends. This clearly indicates that significantly more earnings are being reinvested in the US compared to Australia. Reinvested earnings can be used to grow the company and increase future earnings, therefore it generally isn’t good for growth if a too-high percentage of earnings is paid out as dividends. This may certainly be a contributing factor to the relative underperformance of the Australian market. Our dividend imputation system contracts growth.
Can we expect a sharp decrease in the Australian Share Market when Companies deliver their earnings reports in the next couple of months?
Most ASX-listed companies’ financial year ends on 31 December or 30 June. Hence most companies’ results to 31 December 2019, which they reported in February, didn’t include the effects upon their earnings of the COVID-19 pandemic and economic shutdown. They’ve recently reported their results to 30 June – which include these effects.
 On 3 June 2020 the Treasurer conceded, and on 2 September, the national accounts confirmed that by the conventional definition (two consecutive quarters during which “headline” GDP decreases) and for the first time in almost thirty years, Australia’s economy had entered into recession. On 30 June, the RBA’s Deputy Governor added that the slump would “likely” be “long-lasting.” The dividend yield has already factored in the expected earnings dilution but what will likely happen when our economy shifts gear and starts to generate what we would expect to be exceptional earnings growth over the next two years.
Will we see an upside after the earnings figures are released?
It is probably worth noting that the Australian stock market has already factored in a “wait and see” view and this current level of the index will probably see it go backwards in the short term up to March. Bearish commentators are expecting a drop of up to 30% or a retreat to the March 2020 lows. Bulls are looking at a contraction to the long term P/E ratio of 20, which will lead to a steady line for the remainder of 2021 as earnings figures start to pick up.
Their is still a great deal of optimism in the local and global markets of a great year for returns but we are not so sure beyond 2021 what the songbook will give us. Let’s wait and see…..
General Advice warning: The content of this newsletter is for the clients of Best Interest Advice and it’s other related services. The content is general advice only and has not considered your personal situation or objectives and cannot be relied upon. Please consult a financial adviser to provide you with personal advice. We cannot guarantee the accuracy of this information as it is sourced from third parties and general media. All attempts to verify its contents have been made and we only rely on reputable sources.


